Understanding Weather Forecasts: A Beginner's Guide to Meteorology Terms
In this beginner's guide to meteorology terms, we'll discuss the three main elements of weather - temperature, air pressure, and humidity - as well as how to read weather maps in order to accurately forecast the weather.

Have you ever wished you could understand the complex language of weather forecasts? 🌦️ Meteorology can be a daunting topic, but with the right guidance, it can be easy! In this beginner’s guide to meteorology terms, we’ll discuss the three main elements of weather - temperature, air pressure, and humidity - as well as how to read weather maps in order to accurately forecast the weather. We’ll also cover some of the most common weather terms you’ll encounter in your daily life, including dew point, wind chill, and more. By the end of this article, you’ll be able to read weather forecasts like a pro! 🤓
What is Meteorology?
Meteorology is the study of the atmosphere and its phenomena, such as weather and climate. 🌍 Meteorologists use data from weather instruments to predict the weather. This data includes temperature, air pressure, and humidity measurements. Understanding these basics can arm you with the knowledge to decipher those complex weather reports. Let’s dive in!
What is the Importance of Meteorology?
Meteorology is not just about predicting daily weather; it’s also crucial for understanding long-term climate patterns and assisting in disaster preparedness. Accurate weather predictions can help farmers know when to plant or harvest crops, assist airlines in avoiding turbulence, and enable governments to issue warnings for severe weather events like hurricanes and tornadoes. In essence, meteorology serves society by ensuring public safety and economic stability.
The Three Main Elements of Weather
Weather forecasting heavily relies on three primary components:
- Temperature
- Air Pressure
- Humidity
These elements provide meteorologists with vital data to create forecasts and predict everything from sunny days to severe storms. Let’s explore each of these components:
Temperature
Temperature measures how hot or cold an area is, and it influences many factors like wind speed, evaporation rate, and air pressure. 🌡️ Always remember that:
- Temperatures are usually measured in degrees Fahrenheit (°F) or Celsius (°C).
- Factors like solar energy, air currents, and humidity can affect temperature.
- Extreme temperatures can have adverse effects on our environment and health.
Here’s a quick visual on temperature scales:
Temperature data is crucial in forecasting as it indicates potential heat changes. For example, high temperatures may lead to heat waves, whereas low temperatures can result in frost or snow.
How to Measure Temperature
Instruments like thermometers, both digital and mercury-based, are used to measure temperature. Satellites also measure temperature by detecting infrared radiation.
Temperature Cycles and Patterns
Temperature exhibits daily and seasonal cycles. During the day, the sun heats the earth’s surface, and temperatures rise. At night, the earth cools as it radiates heat back into space. Temperature also varies with the seasons. Summer temperatures are generally higher due to the increased angle and duration of sunlight, while winter temperatures are lower due to less sunlight and its lower angle.
Air Pressure
Air pressure is a measure of the weight of air molecules in a given area. 🌬️ This element plays a significant role in determining weather patterns:
- High-Pressure Systems: Usually bring clear skies and mild temperatures.
- Low-Pressure Systems: Often result in cloudy skies and precipitation.
Barometers are used to measure air pressure. By understanding and tracking changes in air pressure, meteorologists can predict rain, storms, and even assess energy requirements for various activities.
Types of Barometers:
- Mercury Barometer: Uses mercury in a tube; height of mercury column indicates air pressure.
- Aneroid Barometer: Uses a small, flexible metal box called an aneroid cell; no liquid involved.
Interesting Fact:
- Low-pressure systems are often found near the equator, contributing to the formation of hurricanes.
Air pressure is closely related to altitude. At higher altitudes, the atmospheric pressure decreases because the density of air molecules is lower.
Humidity
Humidity refers to the amount of moisture present in the air. 💧 It impacts temperature regulation, cloud formation, and precipitation:
- High Humidity: Makes temperatures feel hotter.
- Low Humidity: Makes temperatures feel cooler.
Humidity is measured by a hygrometer and is often represented by the dew point, which is the temperature at which air becomes saturated with water vapor. High levels of humidity can create stormy conditions, so understanding this element can help predict rain or snowfall.
Dew Point Levels:
How Humidity Affects Comfort
High humidity can make hot temperatures feel even hotter, a phenomenon measured by the Heat Index. Conversely, low humidity can make cold temperatures feel even colder, a phenomenon measured by the Wind Chill Factor.
Humidity and Health
- Heat Stroke: High humidity and high temperatures can increase the risk of heat-related illnesses.
- Respiratory Issues: Extremely low humidity can dry out the respiratory tract.
- Skin Comfort: Both high and low humidity levels can affect skin comfort and health.
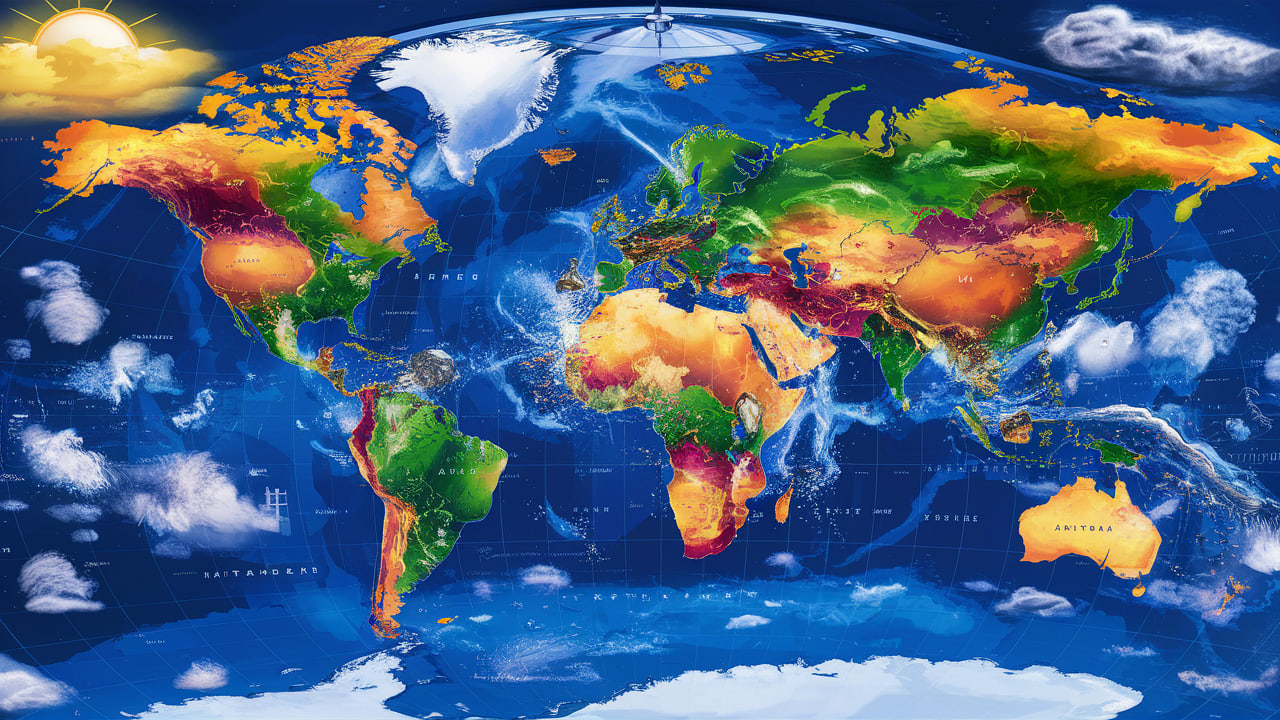
Weather Maps
Weather maps are indispensable tools that meteorologists use to predict the weather. These maps plot data from various instruments and satellites to visually represent atmospheric conditions. 🗺️
Key Features of Weather Maps:
- Isobars: Lines that connect points with the same barometric pressure.
- Station Models: Small diagrams that show current conditions in different locations.
- Satellite Images: Illustrate cloud cover and can predict where storms may form.
By studying these features, meteorologists can understand what kind of weather to expect in various regions and make accurate forecasts.
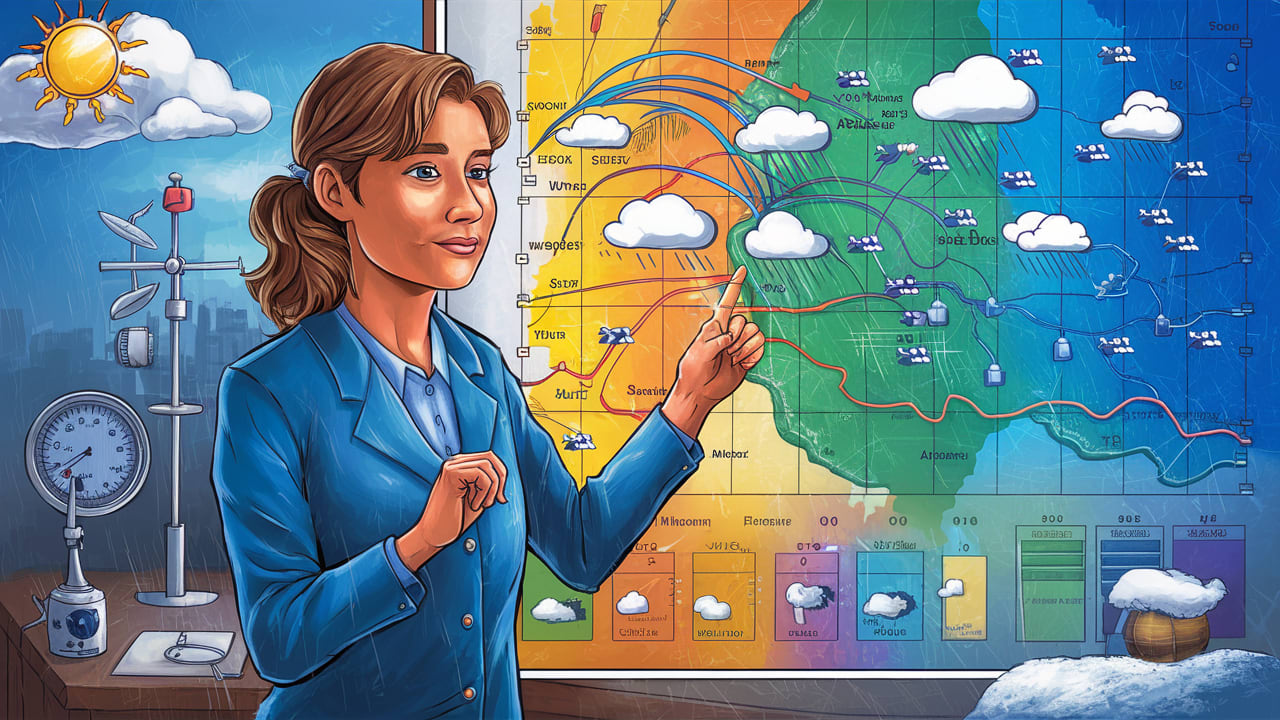
How to Read a Weather Map
Isobars:
- Tightly Packed Isobars: Indicate strong winds.
- Widely Spaced Isobars: Indicate calm conditions.
Station Models:
- Temperature: Displayed in the upper left.
- Dew Point: Shown in the lower left.
- Wind Direction: Indicated by a barb pointing from the wind’s origin.
Satellite Images:
- Cloud Cover: More clouds indicate storms or rain.
- Clear Skies: Typically found in high-pressure systems.
Examples of Weather Maps
Weather maps can reveal why certain regions experience particular types of weather. For instance:
- The European Weather Map often shows warm fronts reaching Europe before Scandinavia.
- Monsoon Maps reveal patterns of heavy rain in certain areas and dry conditions in others.
- Storm Path Maps demonstrate why coastal regions with higher air pressure tend to avoid direct hits from storms.
By combining temperature readings, air pressures, and humidity levels, meteorologists create accurate forecasts that can save lives by predicting extreme events like hurricanes and floods weeks in advance. With modern technology like Optic Weather App’s cutting-edge A.I., even more precise predictions are now possible than ever.
Forecasting the Weather
Forecasting involves analyzing data from weather instruments, maps, and other sources to make predictions. The following components are critical:
- Air Pressure: Essential for predicting storms and assessing energy needs.
- Temperature: Indicates how heat will interact with other elements.
- Humidity: Measures moisture in the air, crucial for rain and snowfall predictions.
Modern tools, like the Optic Weather App, utilize advanced algorithms to provide real-time, hyper-accurate forecasts, ensuring users stay well-informed.
Technologies Used in Weather Forecasting
Satellites:
Satellites orbiting the Earth provide real-time data on weather conditions, such as temperature, moisture levels, and cloud cover.
- Types of Satellites:
- Geostationary Satellites: Remain fixed over a particular region, providing continuous data.
- Polar-Orbiting Satellites: Orbit from pole to pole, covering the entire globe over time.
Radars:
Doppler radar provides data on precipitation, including its intensity, motion, and type.
- Rainfall Radar: Measures the intensity and movement of precipitation.
- Wind Profile Radar: Measures the speed and direction of winds at various altitudes.
Weather Models:
Supercomputers run complex mathematical models that simulate the Earth’s atmosphere. These models integrate vast amounts of data to predict how the weather will evolve over hours, days, or weeks.
- Global Forecast System (GFS): A widely used weather model providing long-range forecasts.
- European Centre for Medium-Range Weather Forecasts (ECMWF): Known for its high accuracy.
Common Weather Terms
Learning common weather terms can make forecasts easier to understand. Here are some of the most frequently used terms:
- Temperature: How hot or cold it is.
- Precipitation: Water falling from the sky, like rain, snow, sleet, or hail.
- Cloud: A mass of condensed water vapor in the sky.
- Humidity: The amount of moisture in the air.
- Dew Point: Temperature at which the air becomes saturated with water vapor.
- Wind: Movement of air across the surface of the Earth.
- Wind Chill: Apparent temperature felt due to wind and cold.
- Heat Index: Apparent temperature felt due to heat and humidity.
- Tornado: A funnel-shaped, destructive windstorm.
- Hurricane: A tropical cyclone with winds of 74 mph (119 km/h) or greater.
- Blizzard: Severe snowstorm with strong winds and heavy snowfall.
- Thunderstorm: Storm with lightning and thunder, often accompanied by rain or snow.
- Frost: Thin layer of ice on the ground or surfaces when temp below freezing.
- Hail: Small balls or lumps of ice that fall during a thunderstorm.
Optic Weather App
Optic Weather App uses cutting-edge A.I. technology to provide users with hyper-accurate weather forecasts and suggested activities for any weather. 🌐 This app is:
- User-Friendly: Easy to navigate interface.
- Detailed: Provides information on temperature, wind speed, precipitation levels, UV index, and more.
- Real-Time Alerts: Sends notifications about severe weather conditions.
By using Optic Weather App, you’re equipped with tools to plan your day and stay safe no matter the weather conditions.
Related FAQs
What is the importance of air pressure in weather forecasting?
Air pressure helps meteorologists predict storms and assess energy requirements for different activities, as high-pressure systems bring clear skies, while low-pressure systems can cause storms.
How can weather maps help in predicting the weather?
Weather maps visually represent atmospheric conditions, using features like isobars, station models, and satellite images to forecast weather patterns accurately.
What’s the difference between humidity and dew point?
Humidity is the amount of moisture in the air, while dew point is the temperature at which air becomes saturated with water vapor.
How does the Optic Weather App make forecasts more accurate?
The app uses advanced A.I. technology and algorithms to provide real-time, detailed predictions and alerts for any location worldwide.
How do satellites contribute to weather forecasting?
Satellites provide real-time data on weather conditions such as temperature, moisture levels, and cloud cover, which are essential for accurate forecasts.
What role do radars play in weather prediction?
Doppler radar provides data on precipitation, including its intensity, motion, and type, which helps in understanding weather patterns and predicting storms.
How do weather models work?
Weather models use supercomputers to run complex mathematical simulations of the Earth’s atmosphere, integrating vast amounts of data to predict weather trends and events.
Why is it important to know the heat index and wind chill?
The heat index and wind chill give a more accurate representation of how the temperature feels on the skin, helping people prepare for extreme weather conditions.
What are some examples of extreme weather events?
Examples include heat waves, cold snaps, hurricanes, tornadoes, blizzards, and heavy rainfall leading to floods.
By understanding these fundamental weather elements and utilizing tools like the Optic Weather App, you’ll be well-equipped to interpret forecasts and prepare for any weather conditions. 🌟 Happy forecasting!


