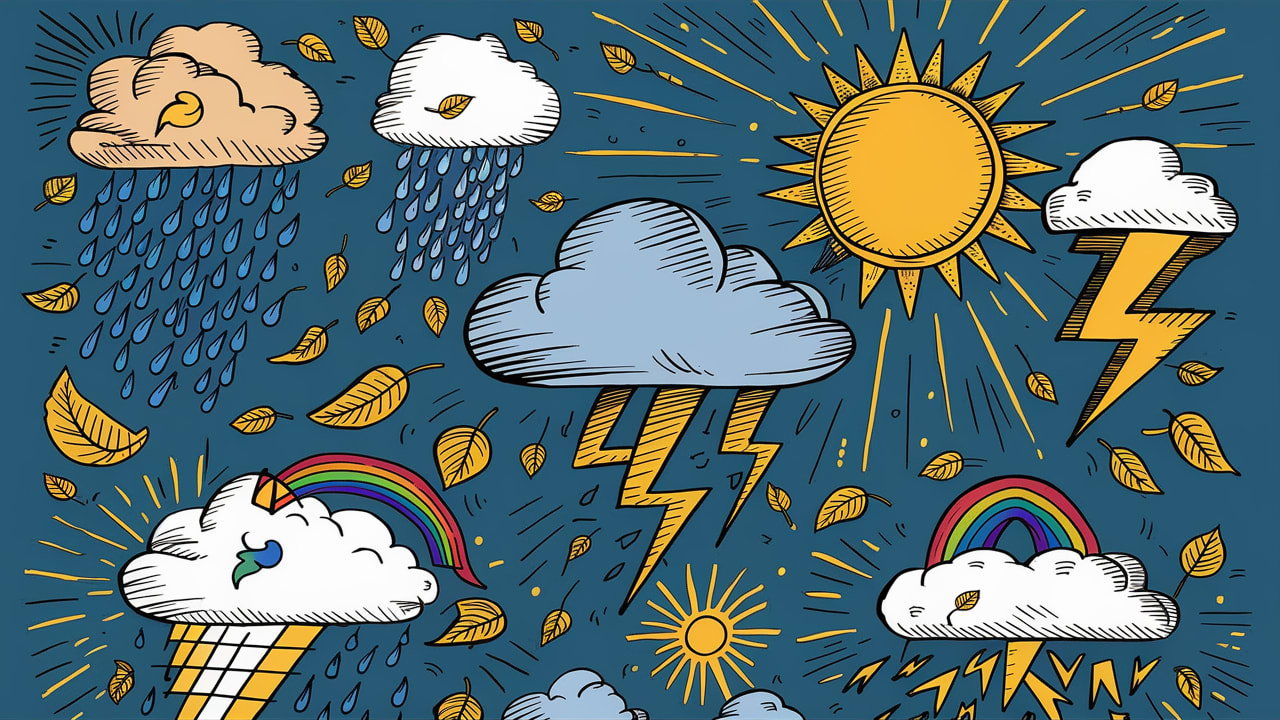
What Do the Different Weather Symbols Mean?
Weather reports are full of symbols and terms that can be confusing. This guide helps you decode them, making the weather easier to understand.

What Do the Different Weather Symbols Mean?
We’ve all seen the arrays of symbols scattered across weather reports and forecasts. But unless you’re a meteorologist, decoding what the different icons actually indicate can get confusing! Plus, there’s a fun interactive quiz halfway through to test your new weather symbol knowledge!
Symbol Basics
Before diving into specifics, let’s cover some fundamental aspects of meteorological symbols:
- Simplicity: With forecast graphics and reports needing to convey much information very visually, symbols stay simple in their depictions.
- Symbolism: Icons aim to directly represent weather elements and conditions through symbolic shorthands people intuitively recognize.
- Uniformity: While some minor styling variations exist, symbols stay relatively consistent across reporting outlets for clarity.
Now that we understand the method to the symbols’ madness, let’s break down common icons section by section!
Sky Cover Symbols
One major component forecasts aim to predict relates to cloud coverage and sky conditions. Various sky symbols help set expectations:
Sunny/Clear Sky
The sun, often including slight wavy lines depicting light heat radiation, signals sunny cloudless days ahead. Enjoy the bright forecast!
Details:
- Sunny icons often use bright yellow or orange to emphasize warmth.
- Variations include additional rays around the sun for extremely sunny conditions.
Partly Cloudy
An iconic circled sun partially covered by a detached cloud indicates partly cloudy skies with a mix of sun and passing clouds expected.
Details:
- Expect about a 50/50 mix of sun and clouds.
- Ideal for outdoor activities that don’t require full sun.
Mostly Cloudy
When an isolated cloud overlaps the majority of the sunshine portions in the sun/cloud symbols, mostly cloudy conditions should materialize with limited brighter bursts.
Details:
- Predominantly cloudy with occasional brief sunny spells.
- Suitable for cooler outdoor activities and gardening.
Mastering the symbols in weather, from the symbols on weather maps to the weather app icons, can dramatically improve your understanding of the symbolism of weather and help you stay prepared. Understanding what is being conveyed with the weather app symbols is a skill that is easy to acquire and can be very useful in planning your day or week ahead.
Overcast
An overcast forecast arises when sun icons disappear altogether behind engulfing cloud coverage unbroken. Expect gray gloominess throughout!
Details:
- Completely covered skies with minimal to no sunlight breaking through.
- Often indicates potential for precipitation.
Fog
Fog symbols often include a sun or moon partially obscured by wavy horizontal lines, indicating reduced visibility due to foggy conditions.
Details:
- This symbol warns of significantly reduced visibility.
- Plan for slower travel and use fog lights if driving.
Precipitation Symbols
Beyond sky conditions, much intrigue surrounds if and when rainfall or frozen precipitation enters the picture. Various symbols help decode wet weather expectations:
Rain
Light raindrop streaks signify showers and general rainfall in the forecast for the timeframe shown. Umbrellas up!
Details:
- Intensity of rain can be suggested by the number of raindrops or angle of streaks.
- Heavier rain often depicted by more substantial streaks or multiple drops.
Freezing Rain/Ice
Jagged shapes suspended underneath raindrops icons represent freezing rain conditions with rain that falls as liquid but freezes on contact with surfaces. Icy!
Details:
- Associated with hazardous travel conditions.
- May lead to power outages due to ice accumulation on power lines.
Snow
The classic white snowflake shape against a sky-blue background confirms winter weather with snowfall in the forecast during those blocks! Time to fire up those snowblowers.
Details:
- Flakes vary in size and detail; more intricate designs can suggest heavier snowfall.
- Snow symbols can be combined with wind symbols to indicate blizzards.
Wintery Mix
When shown together amidst rainy icons, snowflake and frozen rain symbols represent an expected wintery mix with icy blending into eventual accumulated snow possible.
Details:
- Indicates a mix of snow, sleet, and freezing rain.
- Often associated with rapidly changing weather conditions.
Thunderstorms
For storms packing more electrical punch, lightning bolt imagery amidst rain icons implies thunderstorms anticipated - a noisy, flashy forecast!
Details:
- Multiple lightning bolts can indicate stronger storms.
- Often paired with wind symbols to forecast severe conditions.
When analyzing a weather map, you’ll notice symbols like warm fronts indicated by a red line, and cold fronts denoted by a blue line with triangles. In addition, the leading edge of a cold air mass is marked by the occluded front, represented by a purple line. Such maps also detail stationary fronts and weather conditions like fog, helping you understand the weather pattern and upcoming shifts.
Drizzle
Fine, light rain often represented by smaller raindrops or lighter blue shades indicating drizzle—continuously light precipitation usually indicative of a damp, cool day.
Details:
- Typical in misty weather and coastal conditions.
- May lightly wet surfaces without causing substantial pooling.
Hail
Symbols for hail feature cluster dots often including a snowflake texture emphasizing cold but heavier impacts rather than soft flakes.
Details:
- Used to warn of hailstones during stronger storms.
- Dangerous to crops and property; remain indoors during occurrences.
Sleet
Jagged lines interspersed with raindrops symbolize sleet, where frozen raindrops and ice pellets fall.
Details:
- Often occurs in tandem with freezing rain.
- Can lead to ice accumulation on roads and walkways.
Tornado
The tornado icon represents an expected tornado or severe tornado conditions. Seek shelter immediately if this symbol appears in your forecast.
Details:
- Indicates potentially dangerous rotating weather systems.
- Accompanied by warning alerts to take cover.
Hurricane
The hurricane icon signifies a hurricane or tropical storm in the forecast. Heavy rain, strong winds, and flooding are expected.
Details:
- Often shown during hurricane season.
- Alerts include evacuation or safety precaution measures.
Atmospheric Symbols
Icons denoting atmospheric qualities like humidity, wind, pressure, and visibility complete the forecast details:
Humidity
The moisture content of air symbolized by vertical wavy lines helps signal muggy, sticky conditions when abundant versus crisper comfier climes when scarce.
Details:
- Density of lines indicates relative humidity levels.
- More lines suggest higher humidity and potential for discomfort.
Wind
Curlicue arrow shapes represent wind direction and intensity expectations. Lengthier arrows or multiple symbols shown together imply louder blustery conditions.
Details:
- Arrow direction indicates wind direction.
- Amount and length of arrows indicate wind speed.
Atmospheric Pressure
Loops with flat bases and circular tops characterize air pressure systems influencing other weather factors. More closely stacked lines mean higher pressure.
Details:
- High-pressure systems generally bring calm, clear weather.
- Low-pressure systems typically indicate stormy weather ahead.
Visibility
The jagged ridged half-circles approximates visible distance through atmospheric clarity or obstructions like fog and haze. More wavy lines cut visibility substantially in reports.
Details:
- More wavy lines indicate lower visibility.
- Alerts for travel conditions to be cautious of.
“Understanding the various weather symbols and icons used in weather maps, weather apps, and iPhone weather symbols can significantly enhance your ability to interpret weather conditions and stay prepared.”
Temperature Extremes
Special symbols denote rising/falling temperature extremes such as thermometer shapes labeled with degrees climbing/descending.
Details:
- Can show extreme heat or cold alerts.
- Useful for planning daily activities appropriately.
Windy
Symbols with multiple curlicue lines or leaf icons blowing in the wind imply windy conditions.
Details:
- Often combined with other elements like rain or snow for storm forecasts.
- Indicates high wind speeds and potentially hazardous conditions.
Heat
Symbols depicting a thermometer with rising temperatures warn of heat waves or extremely hot weather ahead.
Details:
- Often accompanied by warnings about staying hydrated and limiting outdoor activities.
- Suggests high UV levels and heat-related illness risks.
Cold
Thermometers showing plummeting temperatures and icy blue colors represent cold snaps or very low temperatures.
Details:
- Indicates the need for warm clothing and heating precautions.
- Associated with frost and potential hypothermia risks.
Percentage (%)
Percent signs are typically used to indicate the probability of precipitation or humidity levels.
Details:
- A higher percentage means a higher chance of rain or higher humidity.
- Useful for gauging the likelihood of carrying an umbrella or experiencing a sticky day.
Units
Various units of measurement help quantify forecast data such as temperature, wind speed, and precipitation amounts.
Details:
- Temperature: Often shown in degrees Celsius (°C) or Fahrenheit (°F).
- Wind Speed: Measured in kilometers per hour (km/h) or miles per hour (mph).
- Precipitation: Shown in millimeters (mm), centimeters (cm), or inches (in).
- Pressure: Measured in hectopascals (hPa) or millibars (mb).
UV Index
A symbol showing the risk levels associated with ultraviolet (UV) radiation from the sun.
Details:
- Often presented as a scale from 0 to 11+.
- Higher numbers suggest stronger UV rays and the need for protection (e.g., sunscreen, hats).
Handy Symbol Reference Table
For easy future symbol sleuthing reference, here’s a handy table matching icons to weather meanings:
Decoding Forecasts Clearly
In summary, while weather pictogram symbols may seem cryptically puzzling initially, breaking down the simple meanings demystifies them into fast visual references!
Consult the guide above whenever symbols pop up in reports and unlock plain language translations for sky cover, precipitation forms, humidity factors, plus more atmospheric insights they aim to convey.
So next time your local forecast contains a set of weather icons that leave you confused and questioning…simply come back to this symbol glossary cheat sheet for handy interpretations at a glance!
If you’re looking for a unique way to explore the weather and get personalized suggestions for what to do based on the forecast, check out Optic Weather’s AI system. It can also recommend activities for a rainy day, snowy day, and more. Happy exploring!


